


Zipkin is a distributed tracing system. It helps gather timing data needed to troubleshoot latency problems in service architectures. Features include both the collection and lookup of this data.
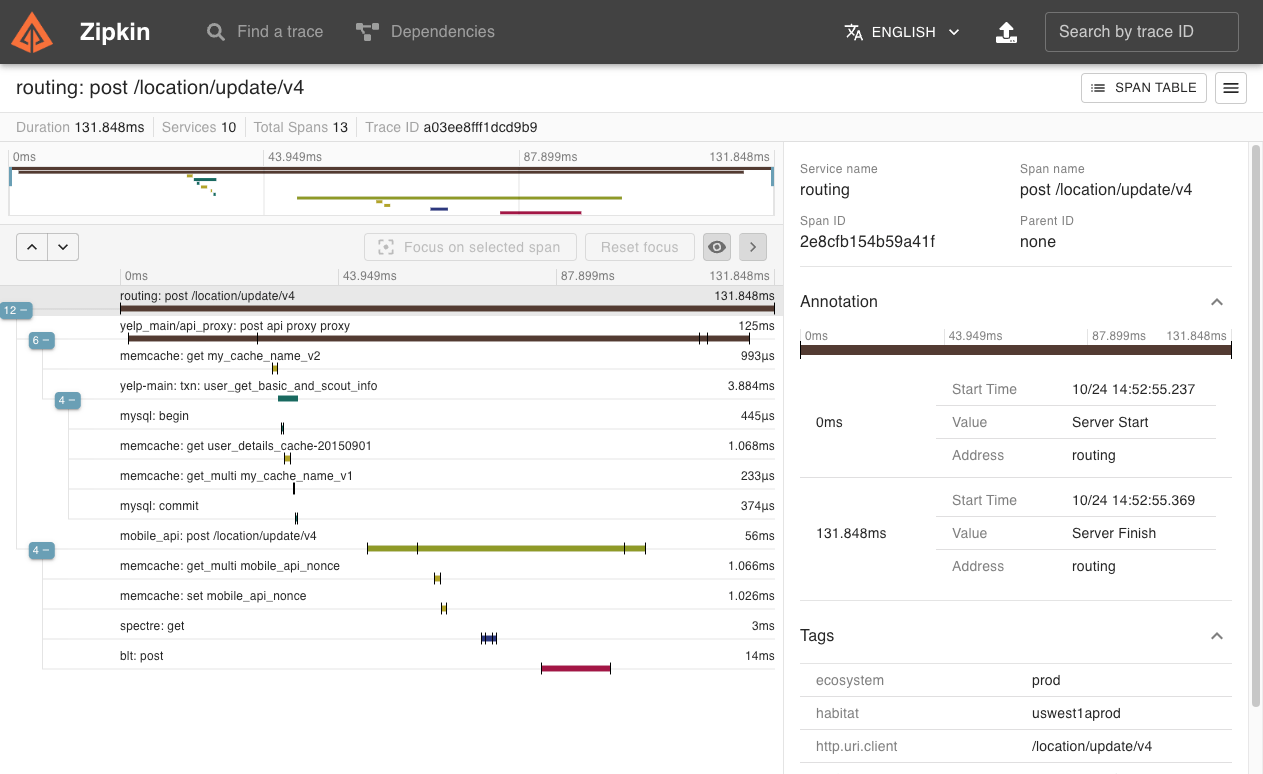
If you have a trace ID in a log file, you can jump directly to it. Otherwise, you can query based on attributes such as service, operation name, tags and duration. Some interesting data will be summarized for you, such as the percentage of time spent in a service, and whether or not operations failed.
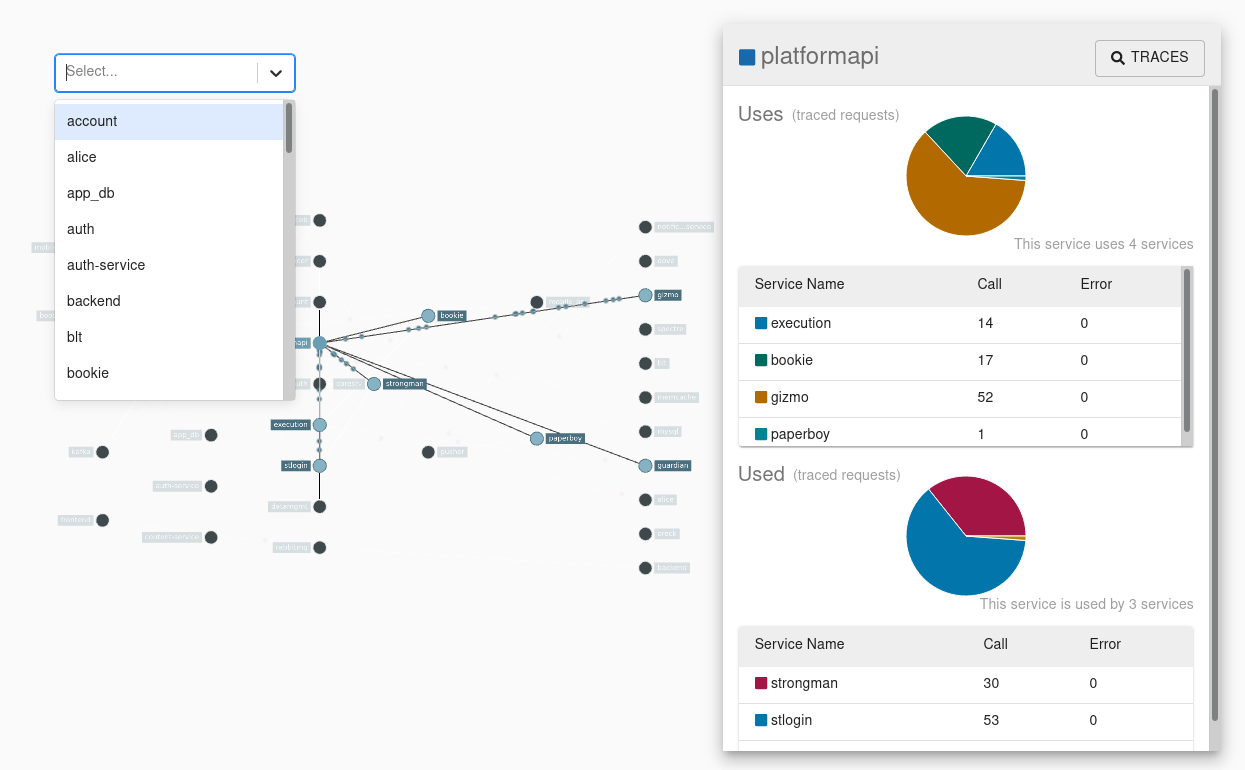
The Zipkin UI also presents a Dependency diagram showing how many traced requests went through each application. This can be helpful for identifying aggregate behavior including error paths or calls to deprecated services.
Applications need to be “instrumented” to report trace data to Zipkin. This usually means configuration of a tracer or instrumentation library. The most popular ways to report data to Zipkin are via HTTP or Kafka, though many other options exist, such as Apache ActiveMQ, gRPC and RabbitMQ. The data served to the UI are stored in-memory, or persistently with a supported backend such as Apache Cassandra or Elasticsearch.