


Tracers live in your applications and record timing and metadata about operations that took place. They often instrument libraries, so that their use is transparent to users. For example, an instrumented web server records when it received a request and when it sent a response. The trace data collected is called a Span.
Instrumentation is written to be safe in production and have little overhead. For this reason, they only propagate IDs in-band, to tell the receiver there’s a trace in progress. Completed spans are reported to Zipkin out-of-band, similar to how applications report metrics asynchronously.
For example, when an operation is being traced and it needs to make an outgoing http request, a few headers are added to propagate IDs. Headers are not used to send details such as the operation name.
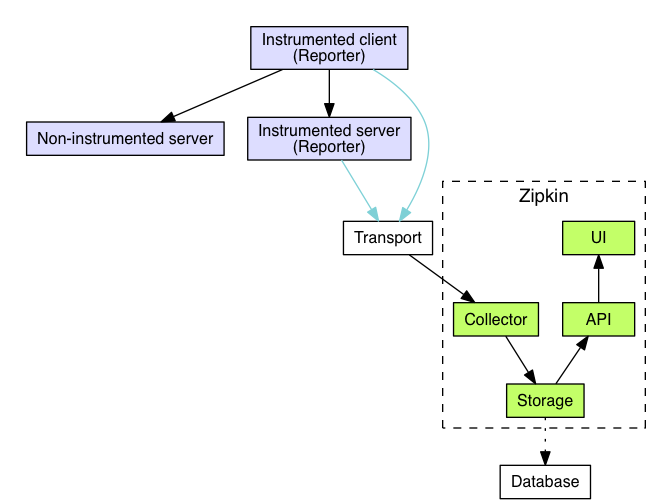
The component in an instrumented app that sends data to Zipkin is called a Reporter. Reporters send trace data via one of several transports to Zipkin collectors, which persist trace data to storage. Later, storage is queried by the API to provide data to the UI.
Here’s a diagram describing this flow:
To see if a tracer or instrumentation library already exists for your platform, see our list.
As mentioned in the overview, identifiers are sent in-band and details are sent out-of-band to Zipkin. In both cases, trace instrumentation is responsible for creating valid traces and rendering them properly. For example, a tracer ensures parity between the data it sends in-band (downstream) and out-of-band (async to Zipkin).
Here’s an example sequence of http tracing where user code calls the resource /foo. This results in a single span, sent asynchronously to Zipkin after user code receives the http response.
┌─────────────┐ ┌───────────────────────┐  ┌─────────────┐  ┌──────────────────┐
│ User Code   │ │ Trace Instrumentation │  │ Http Client │  │ Zipkin Collector │
└─────────────┘ └───────────────────────┘  └─────────────┘  └──────────────────┘
       │                 │                         │                 │
           ┌─────────┐
       │ ──┤GET /foo ├─▶ │ ────┐                   │                 │
           └─────────┘         │ record tags
       │                 │ ◀───┘                   │                 │
                           ────┐
       │                 │     │ add trace headers │                 │
                           ◀───┘
       │                 │ ────┐                   │                 │
                               │ record timestamp
       │                 │ ◀───┘                   │                 │
                             ┌─────────────────┐
       │                 │ ──┤GET /foo         ├─▶ │                 │
                             │X-B3-TraceId: aa │     ────┐
       │                 │   │X-B3-SpanId: 6b  │   │     │           │
                             └─────────────────┘         │ invoke
       │                 │                         │     │ request   │
                                                         │
       │                 │                         │     │           │
                                 ┌────────┐          ◀───┘
       │                 │ ◀─────┤200 OK  ├─────── │                 │
                           ────┐ └────────┘
       │                 │     │ record duration   │                 │
            ┌────────┐     ◀───┘
       │ ◀──┤200 OK  ├── │                         │                 │
            └────────┘       ┌────────────────────────────────┐
       │                 │ ──┤ asynchronously report span     ├────▶ │
                             │                                │
                             │{                               │
                             │  "traceId": "aa",              │
                             │  "id": "6b",                   │
                             │  "name": "get",                │
                             │  "timestamp": 1483945573944000,│
                             │  "duration": 386000,           │
                             │  "annotations": [              │
                             │--snip--                        │
                             └────────────────────────────────┘
Trace instrumentation report spans asynchronously to prevent delays or failures relating to the tracing system from delaying or breaking user code.
Spans sent by the instrumented library must be transported from the services being traced to Zipkin collectors. There are three primary transports: HTTP, Kafka and Scribe.
There are 4 components that make up Zipkin:
Once the trace data arrives at the Zipkin collector daemon, it is validated, stored, and indexed for lookups by the Zipkin collector.
Zipkin was initially built to store data on Cassandra since Cassandra is scalable, has a flexible schema, and is heavily used within Twitter. However, we made this component pluggable. In addition to Cassandra, we natively support ElasticSearch and MySQL. Other back-ends might be offered as third party extensions.
Once the data is stored and indexed, we need a way to extract it. The query daemon provides a simple JSON API for finding and retrieving traces. The primary consumer of this API is the Web UI.
We created a GUI that presents a nice interface for viewing traces. The web UI provides a method for viewing traces based on service, time, and annotations. Note: there is no built-in authentication in the UI!